How Do Convection and Microphysics Parameterizations Impact a Regional Weather Forecast with ICON-LAM?
Training Objectives: The main objectives of this training exercise are to
learn to make a regional weather forecast with the ICON model in limited area mode (LAM)
study the sensitivity of simulated atmospheric variables (e.g. precipitation) on model parameterization choices
work on a supercomputing platform incl. compilation of model source code and submission of simulation jobs
ICON (see https://code.mpimet.mpg.de/projects/iconpublic)
The ICON modelling framework is a joint project between the German Weather Service and the Max Planck Institute for Meteorology for developing a unified next-generation global numerical weather prediction and climate modelling system. The ICON model has been introduced into DWD`s operational forecast system in January 2015.
Getting Started / Preparations
Do you already have an account for the DKRZ? If not, ask you supervisor!
Learn to work with the High-Performance Computing (HPC) platform “Levante”
“Levante” is the supercomputer at DKRZ (see https://www.dkrz.de/de/projekte-und-partner/HLRE-Projekte/focus/levante-fokus). It is a Linux server.
You will mainly work on Levante in a “Terminal”. (https://www.giga.de/extra/linux/specials/linux-befehle/)
Please make familiar with standard bash commands. (https://www.educative.io/blog/bash-shell-command-cheat-sheet)
Login to “Levante” (chosse one of the next options):
via
sshin your own Linux terminal: If<MyUser>stands for your account (or the account you selected in your group as main account), than login works as follows:ssh <MyUser>@levante.dkrz.deYou will be asked for your password. Please enter it and proceed! You will end in your home directory.
In a “Terminal”, editing a file is a little bit less intuitive than in a GUI. We will use
vimas editor. Please make yourself familiar with basic commands (see e.g. https://opensource.com/article/19/3/getting-started-vim or https://www.openvim.com/)via JupyterHub, browser-based terminal: If you have no linux on your local computer, you can use to entirely base your work on JupyterHub (see Getting Started with JupyterHub). You can open a terminal also there and submit linux commands. Moreover, you can edit files in the JupyterHub editor.
Special commands (e.g.
sbatch,scancel,squeue) exist to submit or cancel simulation jobs on Levante. The job scheduler is called slurm. Please read through this page (https://docs.dkrz.de/doc/levante/running-jobs/index.html) before you start your first job!
JupyterHub can be used for data analysis with Python. A dedicated tutorial exists to help you to get started.
Preparations for a Clean Environment: It seems to be that conflicting modules are used in the ECHAM and in the ICON exercises. Hence, before we start here, we need to clean our enviroment on levante.
After login with
ssh(see also below)check if there is a
.bash_profilefilels ~/.bash_profile
if yes, open the file in
vimand comment the content out!logout (
exit) and login again withsshunload all modules (this is to be really on the save side!)
module purge
EXERCISE 1: Make the First ICON Simulations (session 2)
![]()
EXERCISE 1.1: Very First Steps on Levante
Log into levante (if you are using jupyterhub terminal: please also type the
sshcommand there to transistion to the levante login node)ssh -X <MyUser>@levante.dkrz.de
Set the exercise path: You can either type this command into your terminal after each login or you write it into your
~/.bashrcand activate it once withsource ~/.bashrc.export EXERCISE_DIR=/work/bb1224/2023_MS-COURSE/
Set the System Language to English:
export LANG=en_US.UTF-8
Get your notebooks: You will copy the example notebooks to your own home directory via:
cd ~
mkdir -p notebooks
cp ${EXERCISE_DIR}/nbooks/0?-*.ipynb notebooks
Link your work directory: ICON data will be too large to fit into your
${HOME}directory we therefore need to do our work at theworkdirectory. We do the linking only once!cd ~ ln -s /work/bb1224/userspace/${USER} workspace
Now move to our
workspacedirectory via:cd ~/workspace
EXERCISE 1.2: Compilation of ICON-LAM
We aim to compile ICON in a separate build directory, so executable and source code are separated.
We make a separate build directory
icon-build:mkdir icon-build cd icon-build
and configure the ICON using Intel compiler settings
# ${EXERCISE_DIR}/model/icon/config/dkrz/levante.intel --help  # can be used to see options
${EXERCISE_DIR}/model/icon/config/dkrz/levante.intel --enable-openmp --disable-jsbach --disable-art
… this takes some time …
Final compilation is done with:
make -j 16
… and this takes even longer … You can proceed with exercise 1.3 to bridge the time or you take a break and grab a coffee.
After successful compilation, the ICON executable is located in the bin directory. Do you find it?
EXERCISE 1.3: Become Familiar with Input Data
ICON needs some input data. The main types are
grid information
external parameters
initial condition data
boundary condition data
Task: Please, go to the DWD website and download the ICON tutorial onto your computer. Chapter 2 “Necessary Input Data” of this tutorial treats all you have to know about ICON input data. Read carefully through it!
Load Post-Processing Tools: We need to load some module to have access to the tools we need:
module load cdo netcdf-c
Computing grid:
The grid data are stored under:
${EXERCISE_DIR}/data/icon-lem/grids-extpar/lpz_r2/To know what is inside the grid file, type:
cdo sinfov ${EXERCISE_DIR}/data/icon-lem/grids-extpar/lpz_r2/lpz_r2_dom01_DOM01.nc
The ICON grid is made of centers, vertices and edges. Another command, that helps are study the grid file is
ncdump -h ${EXERCISE_DIR}/data/icon-lem/grids-extpar/lpz_r2/lpz_r2_dom01_DOM01.nc
Task: Search for the attritubes:
<grid_root>&<grid_level>. Both combine to the resolution shortcutR<grid_root>B<grid_level>typically used to indicate the underlying ICON grid. Use equation (2.1) from the ICON tutorial to estimate the effective mesh size.
External parameters (extpar)
The external parameters are also stored under:
${EXERCISE_DIR}/data/icon-lem/grids-extpar/lpz_r2/Type:
cdo sinfov ${EXERCISE_DIR}/data/icon-lem/grids-extpar/lpz_r2/external_parameter_icon_lpz_r2_dom01_DOM01_tiles.nc
or
ncdump -h ${EXERCISE_DIR}/data/icon-lem/grids-extpar/lpz_r2/external_parameter_icon_lpz_r2_dom01_DOM01_tiles.nc
to see the content.
Initial conditions (IC):
IC are stored here:
${EXERCISE_DIR}/data/icon-lem/bc-init/lpz_r2/IC are derived from 0z analysis of the ECMWF forecast model IFS. It mainly contains prognostic variables as 3D fields and some surface properties (incl. soil moisture)
Type:
cdo sinfov ${EXERCISE_DIR}/data/icon-lem/bc-init/lpz_r2/init_lpz_r2_dom01_DOM01_ecmwf-ana-global-2021051600.nc
Boundary conditions (BC):
BC are also stored here:
${EXERCISE_DIR}/data/icon-lem/bc-init/lpz_r2/BC are derived from forecasts of the ECMWF forecast model IFS initialed at 0z.
Type:
cdo sinfov ${EXERCISE_DIR}/data/icon-lem/bc-init/lpz_r2/latbc_bc-grid-lpz_r2_dom01_DOM01.grid_ecmwf-fc-ce-20210516-0_12.nc
BC are only given close to the domain edge. Do you see the difference in the number of grid points compared to the IC?
Task: Open JupyterHub as described here. In JupyterHub, launch a copy of your tutorial notebook ~/notebooks/01-Plotting-ICON-Topography.ipynb, run it and solve all included tasks. It shows you how to open the grid file and how to work with the grid and external parameters of ICON.
EXERCISE 1.4: Get and Prepare the Runscript
Get the experiment script
Once installation of ICON is done, you need a dedicated experiment script to configure and start your simulation.
To get an own copy of the prepared script, type:
cd ~/workspace/icon-build
cp ${EXERCISE_DIR}/material/exp.icon_lam_1dom_lpz-base run
Now, you have your experiment script in your
runfolder.
Prepare the test run
Our first test should only run for a small time period, say one hour. This needs to be input into our experiment script.
Open the script in
vim:cd run vim exp.icon_lam_1dom_lpz-base
Search for the
end_datevariable.Input a string for
end_datein a similar way as is already done forstart_date(but with +1 hour). Check ICON tutorial if you need some infos on the time string format.
EXERCISE 1.5: Make a Test Run and a Base Run
Make your first test run:
You need to convert your experiment script into a run script (This is specific for DKRZ servers). Note that only the experiment name is used in the command (the prefix
exp.is omitted)!cd .. ./make_runscripts icon_lam_1dom_lpz-base cd run
Now you should have obtained a new script called
exp.icon_lam_1dom_lpz-base.run. Open it withvim(write back with “:wq”).Check the slurm directives! The following directives need to be there (among all others) … Please add a directive if not present! Take care that all duplicate entries are removed!
#SBATCH --account=bb1224
#SBATCH --nodes=3
It selects 3 nodes of the supercomputer Levante. Each node has 128 CPU cores.
Start your first ICON job with
sbatch exp.icon_lam_1dom_lpz-base.runand monitor your job as described in Running_jobs_at_DKRZ.
Task: Check the logfile (something that starts with
LOG.exp.icon_lam_1dom_lpz-base.run*). Open it withvim. Did your test run through without errors?
Make the base run:
The base run of our ICON sensitivity study shall compute one day, i.e. 24 hours.
Open
exp.icon_lam_1dom_lpz-baseagain and modifyend_dateaccordingly.vim exp.icon_lam_1dom_lpz-baseThen, you need to repeat all steps (create a run script + adapt slurm directives + submit with
sbatch) as for the short test run. Try to be concentrated ;-)Take a look at the new logfile again. Did everything go fine?
EXERCISE 1.6: Analyze Your Data on JupyterHub
Where are the ICON data?
The output data are stored in your workspace under
~/workspace/icon-build/experiments.Check the content with
ls ~/workspace/icon-build/experimentsor
find ~/workspace/icon-build/experiments -iname '*.nc'
Remember your ICON data - you need to replace the default ICON data path with your individual data path in the notebooks!
Open JupyterHub
See and recall Getting_Started_with_JupyterHub_at_DKRZ.
Go to your
notebooksdirectory.Run your Jupyter notebook with modified ICON data path (consider tasks in the notebooks).
Save images:
A low-resolution version of the images in your notebook are copied to clickboard with pressing [SHIFT] + [right mouse click].
In order store the figure as PNG file, add the following at the end of the plotting code block.
plt.savefig ("my_image.png" )
(see also https://matplotlib.org/stable/api/_as_gen/matplotlib.pyplot.savefig.html). The figure will be stored in your
notebooksdirectory. You may use e.g. sftp to download and view it on your local computer.
EXERCISE 2: Make a Sensitivity Run with Respect to Cloud Microphysics (session 3)
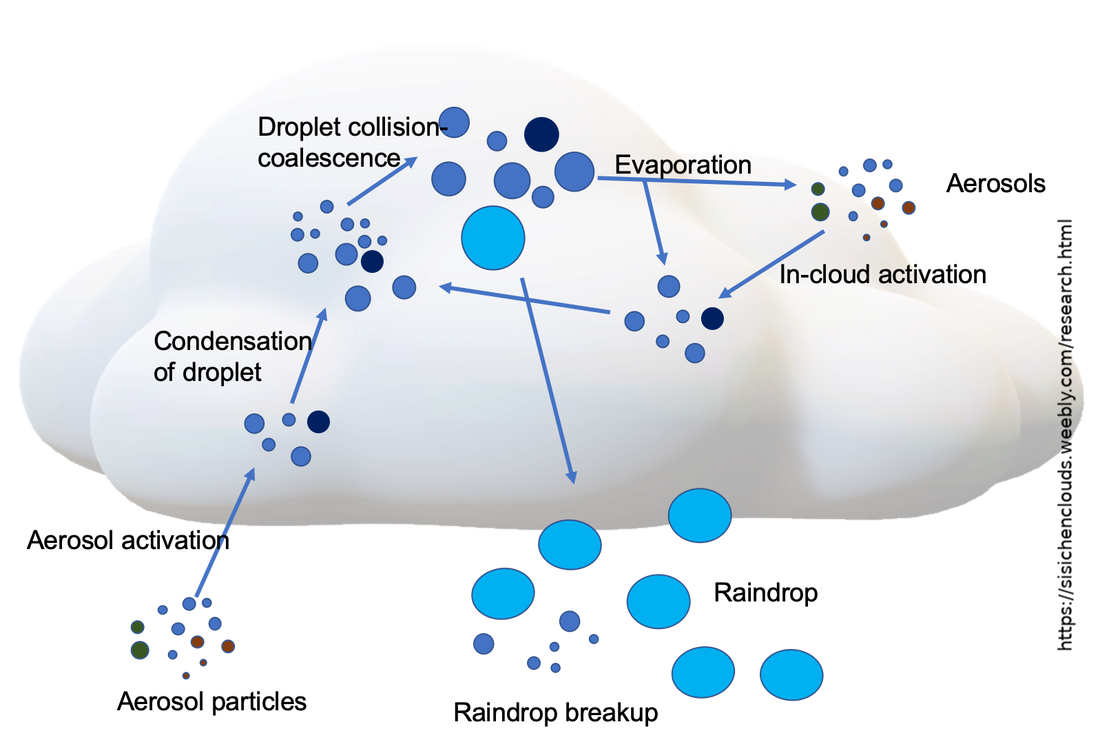
In this exercise, we will modify parameters controlling the gridscale cloud microphysics and test what changes will result in the ICON forecasts.
At the beginning (see exercise 1.1):
log into levante via
sshexport the variables
${EXERCISE_DIR}&${LANG}
EXERCISE 2.1: Prepare a New Experiment
Copy experiment script:
Go to your
runfolder in the ICON installation.cd ~/workspace/icon-build/run/
Create a new experiment script. We will start from our “old” experiment script called
exp.icon_lam_1dom_lpz-baseby copying it.cp exp.icon_lam_1dom_lpz-base exp.icon_lam_1dom_lpz-sens01
Our new experiment is called “icon_lam_1dom_lpz-sens01”!
Modify cloud microphysics:
Open the experiment script with
vim:vim exp.icon_lam_1dom_lpz-sens01
Search for the namelist variable “inwp_gscp”
What is the current value of this variable? And what does this mean? (See ICON tutorial, chapter 3.8.3)
Change cloud microphysics settings
We want to switch to a single-moment microphysics scheme that also predicts the hydrometeor category “graupel”. What setting of “inwp_gscp” would that be?
Apply the change in your experiment file and save the changes in
vim(apply “:wq”).
EXERCISE 2.2: Perform ICON sensitivity run
All these steps here are similar to the preparations already done in exercise 1.5! The only exception is that your experiment script is now named exp.icon_lam_1dom_lpz-sens01 and not exp.icon_lam_1dom_lpz-base. Everything clear so far?
Prepare run script:
Create a runscript with
make_runscripts.Modify slurm directives (starting with
#SBATCH).
Start your cloud microphysics run:
sbatch exp.icon_lam_1dom_lpz-sens01.run
Check job and logs:
Use
squeue -u ${USER}to see if your job is running.Have a look at your logs. Now, your logfile starts with
LOG.exp.icon_lam_1dom_lpz-sens01.run.*.Is everthing OK? What data is in the experiment directory
ll ~/workspace/icon-build/experiments/icon_lam_1dom_lpz-sens01? Is everything complete? [1]
EXERCISE 2.3: Analyze your Data on JupyterHub
Open JupyterHub again.
Analyze the model results and differences between base and sensitivity run with Jupyter notebooks.
Use notebooks from session 2 and plot variables for your data in the new path
~/workspace/icon-build/experiments/icon_lam_1dom_lpz-sens01Analyze physics tendencies
Follow the example 02-Plot_Profiles_from_ICON_3D_Data.ipynb.
Make a copy of this notebook and rename it accordingly.
Change input files, take the onces related to physics tendencies (
3d_full_tend*Z.nc).Plot average tendencies.
Can you interpret the outcome?
Direct comparison of base and sensitivity run.
Follow the example 05-Compare_Data_from_different_Sensitivity_Experiments.ipynb.
It provides you a method to read several experiments into one notebook for direct comparison (see input cell [8])
Change the list of experiments
exp_list = ['base', 'sens01', 'sens02']
to
exp_list = ['base', 'sens01', ]
in input cell [6] before you run the notebook.
Note and complete the tasks at the end of the notebook.
ADVANCED:
Try to combine the notebooks 02-Plot_Profiles_from_ICON_3D_Data.ipynb and 05-Compare_Data_from_different_Sensitivity_Experiments.ipynb into a new notebook.
Do it in such a way that the average physics tendencies for both experiments are input and plotted.
EXERCISE 3: Make Sensitivity Run with Respect to Convection (session 4)
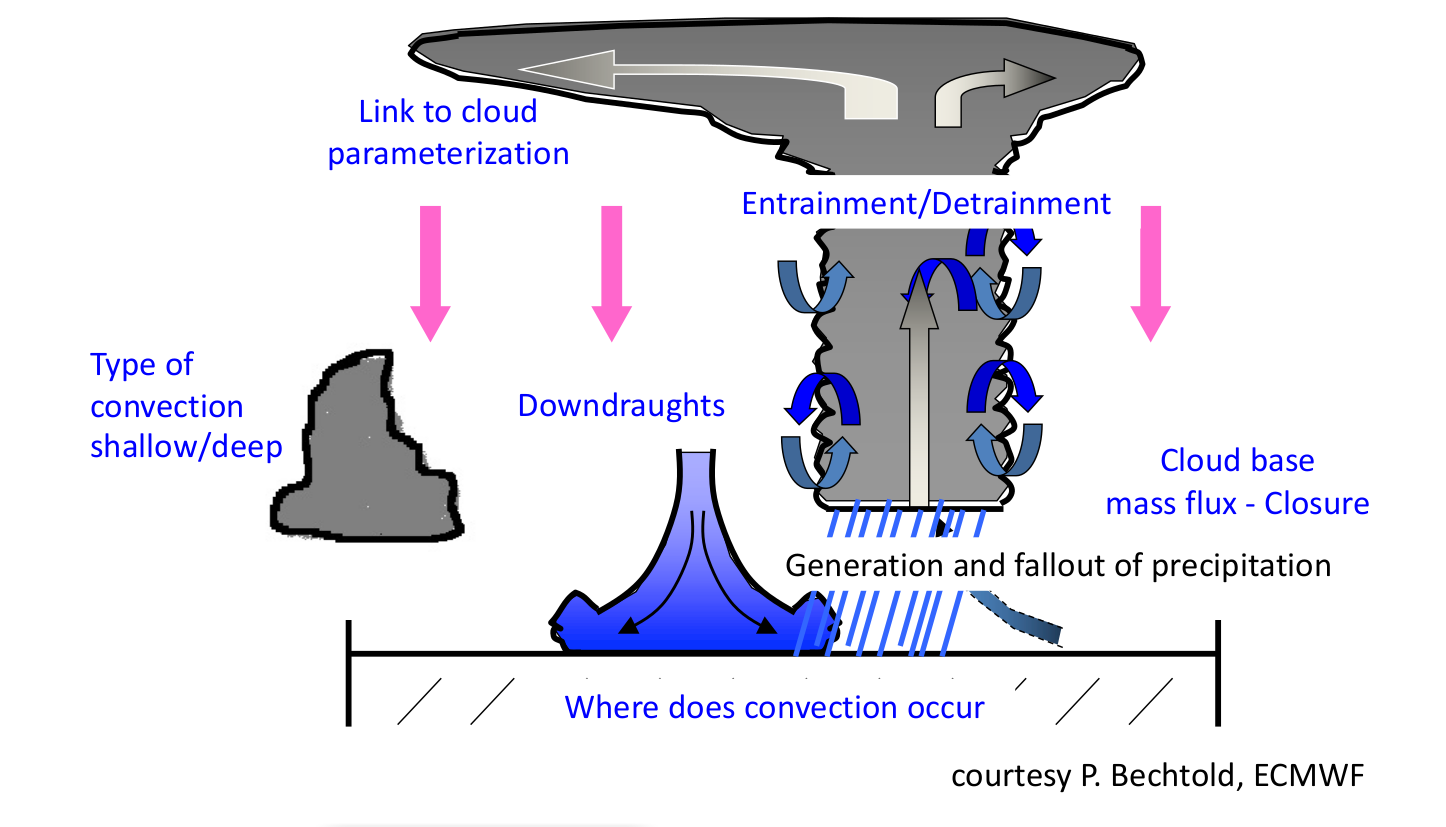
In this exercise, we will modify parameters controlling the convection parameterization and test what changes result in the ICON forecasts. The way, we walk through the exercises is very similar to the exercises 2 from session 3.
At the beginning (see exercise 1.1):
log into levante via
sshexport the variables
${EXERCISE_DIR}&${LANG}
EXERCISE 3.1: Prepare a New Experiment
Copy the experiment script:
Go to your
runfolder in the ICON installationcd ~/workspace/icon-build/run/
Create a new experiment script. We will start from our “old” experiment script called
exp.icon_lam_1dom_lpz-baseby copying it.cp exp.icon_lam_1dom_lpz-base exp.icon_lam_1dom_lpz-sens02
Our new experiment is called “icon_lam_1dom_lpz-sens02”!
Modify the convection settings:
Open the experiment script with
vim:vim exp.icon_lam_1dom_lpz-sens02
Search for the namelist variable “inwp_convection” (you will find it at line 175, just below the clouds microphysics parameter)
What is the current value of this variable? And what does this mean? (See ICON tutorial, chapter 3.8.4)
Switch the convection parameterization off.
We want to switch the parameterization of moist convection off. What setting of “inwp_convection” would it be?
Apply the change in your experiment file and save the changes in
vim(apply “:wq”)
EXERCISE 3.2: Perform ICON sensitivity run
All these steps are again similar to the preparations already done in exercise 1.5 and in exercise 2.2! The only exception is that your experiment script is now named exp.icon_lam_1dom_lpz-sens02 and not exp.icon_lam_1dom_lpz-base or exp.icon_lam_1dom_lpz-sens01. Everything clear so far?
Prepare run script:
Create a runscript with
make_runscripts.Modify slurm directives (starting with
#SBATCH).
Start your run without convection parameterization:
sbatch exp.icon_lam_1dom_lpz-sens02.run
Check job and logs:
Use
squeue -u ${USER}to see if your job is running.Have a look at your logs. Now, your logfile starts with
LOG.exp.icon_lam_1dom_lpz-sens02.run.*.Is everthing OK? What data are in the experiment directory
ll ~/workspace/icon-build/experiments/icon_lam_1dom_lpz-sens02? Is everything complete?[2]
EXERCISE 3.3: Analyze your Data on JupyterHub
Open JupyterHub again.
Analyze the model results and differences between base and sensitivity run with Jupyter notebooks.
Use notebooks from session 2 & 3 to plot variables from your model results in the new path
~/workspace/icon-build/experiments/icon_lam_1dom_lpz-sens02Analyze physics tendencies
Follow the example of 02-Plot_Profiles_from_ICON_3D_Data.ipynb.
Make a copy of this notebook and rename it accordingly.
Change the input files, take the onces related to physics tendencies (
3d_full_tend*Z.nc).Plot average tendencies.
Can you interpret the outcome?
Direct comparison of base and sensitivity run.
Follow the example of 05-Compare_Data_from_different_Sensitivity_Experiments.ipynb
It provides you a method to read several experiments into one notebook for direct comparison (see input cell [8]).
Now, you need to change this cell back to
exp_list = ['base', 'sens01', 'sens02']
before you run the notebook again.
Again, note and complete the tasks at the end of the notebook.
ADVANCED:
Try to combine the notebooks 02-Plot_Profiles_from_ICON_3D_Data.ipynb and 05-Compare_Data_from_different_Sensitivity_Experiments.ipynb into a new notebook.
Again, do it in such a way that the average physics tendencies for both experiments are input and plotted.
EXERCISE 4: Prepare you Results for a Final Discussion (end of session 4 + session 5)
Finish up plots and interpret your results!
Select visualization and summarize the most important changes you found.
Prepare a bief presentation (max. two slides per exercise).
Contribute actively to the final discussion.